
The popular peak oil blog The Oil Drum (TOD) began in early 2005. I joined as a contributor in mid 2005, later becoming an editor, and I left the site in early 2008. TOD continued in the meantime, at least up until now when the current editors have decided to transition to an archival format. They don't feel the quality and quantity of post submissions justify continuing. They asked a number of us old-timers to comment on the significance of TOD, and these are my reflections.
I start with the chart above. It shows, from 1950-2012, world oil production annually (red curve, left scale), and real oil prices annually (blue curve, right scale). I show in green boxes two regions of major disruption, and between them two regions of relatively calm behavior (in white).
The orderly region from 1950 to 1973 was characterized by very rapid growth in oil production that was achieved at very modest oil prices (around $20/barrel in 2011 dollars).
Then in 1973 came the Arab oil embargo, followed in 1979 by the Iranian revolution and then the Iraq-Iran war. These events caused a series of sharp but relatively short-lived contractions in the global oil supply. The result was huge price increases, and a permanent change in the way the world used oil.
After the dust settled in the mid eighties, oil production resumed growing fairly steadily, but never again at the frenetic pace of before the seventies - from now on society was more concerned with fuel efficiency and grew oil consumption more slowly. Prices fell into the $30 range, and remained there, give or take, for the next couple of decades. This was the second period of stability in the oil markets since WWII.
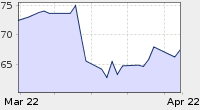
Then, in late 2004, global oil production largely stopped growing and entered a rough plateau. Prices began to shoot up, reaching well over $100/barrel within a few years, and largely staying there to this day (making allowance for a sharp downward fluctuation during the great recession).
There sprang up a large debate about the meaning of these events. The Oil Drum in particular I believe came to function as a central node in this debate, and one of the best places to hear a range of views that were based on a close analysis of the available data. The reason TOD is now coming to a close is that the need for this particular debate is over, at least for the time being. The data have spoken.
One extreme in this debate was what came to be known as cornucopians, epitomized by Daniel Yergin of the consultancy CERA. He made a long series of predictions that oil production would resume growing and prices would fall any day now. This was most famously satirized in a graph by Glenn Morton:

Another extreme in the debate were "doomers" who believed that global oil production would begin to fall very rapidly, very soon, because peak oil was upon us. "We're all gonna die" was the logical implication. One such forecaster was TOD contributor Ace who produced a series of forecasts like this one which showed oil production beginning a precipitous decline as of the date of the forecast:

The same piece forecast oil prices to rise rapidly and steadily and pass $200/barrel by the end of 2012. That didn't happen either.
I'm not sure anyone predicted the last eight years perfectly (including me). Still, on the whole, the various "moderates" in the debate came closest. What has actually occurred can best be seen in this graph which shows monthly oil production from a variety of data sources from 2002 onward:

The green curve is the EIA's estimate of the production of "crude and condensate" - C&C - which is a fairly narrow definition of oil that largely measures liquid hydrocarbons that flow out of the ground. The other curves show various estimates of "all liquids", which adds things like biofuels and "natural gas liquids" - compounds like propane and butane removed from natural gas production. These aren't really oil, but can substitute for it to varying degrees and so are often counted with it.
The crude-and-condensate curve is bumpy, but does slope upward slightly. The all liquids curve slopes up more, reflecting the fact that global natural gas production has increased steadily. High oil prices and government policies also induced a biofuel boom after 2005.
Thus we seem to live in a world in which, although traditional sources of oil are declining in many places, high oil prices (around $100-$120) are able to bring out enough low quality sources of hydrocarbon to offset this decline and just a bit more. Examples include oil fracced from very tight rocks in North Dakota, and tar sands production in Canada. These sources are difficult enough to bring on line that prices have not crashed, but are sufficient to prevent global oil production from actually declining. Clearly, we have not passed peak oil yet, and it's not at all clear when we will.
In the meantime, the situation has gotten quite dull. I compile graphs of oil production every month, and it's gotten somewhat akin to watching paint dry; every month, it's pretty much flat, and I tire of saying the same things over and over again.
On the other hand, we certainly don't live in the pre-2004 world any more. Oil prices are high, and there seems little prospect that they will ever fall below $100/barrel for any sustained period. If for no other reason, Saudi Arabia needs an oil price somewhere around there to balance its budget, and they are always in a position to force the price to stay above that threshold by modest decreases in their production.
Furthermore, the situation remains very vulnerable to disruption. Whereas in the eighties and nineties there was large amounts of spare capacity in oil production, nowadays there is little, and perhaps almost none. Any disruption in any sizeable oil producer will cause a large price spike - as we saw in 2011 when a revolution in Libya, which produced less than 2% of the world's oil, caused a sizeable price spike.
As I write, Libya, Tunisia, Egypt, Syria, Lebanon, Iraq, and Iran are all subject to varying degrees of economic and political turmoil. We in the west are apparently about to bomb the Syrian government, as an interesting experiment to see what that does to the stability of the Middle East.
I assume at some point a large oil producer will descend into turmoil and then there will be a large price spike, and that may kick the global oil market out of the current meta-stable state. However, there is no telling when that might happen. In the mean time, oil production slowly creeps upward, and oil prices are around $100-$120.
One final point worth making: while global oil production has not peaked, oil consumption by the developed OECD countries almost certainly has. Since China, India, the Middle East, etc are all growing their production rapidly, and global supply is almost stagnant, OECD consumption must decline, and it has been:

I do not expect OECD consumption of oil to surpass its 2005 peak.


13 comments:
A very good summary, thanks.
A good try to find a sensible way in between cornucopians and doomers can be found in this 2012 IMF working paper:
http://www.imf.org/external/pubs/cat/longres.aspx?sk=25884
Thank you for another clear, balanced picture of our complex energy situation.
Hi Stuart - Great work here and the years at the Oil Drum. Would it be safe to say that we have hit the end of cheap oil?
The one ratio I really like to look at is the EROEI. Where conventional oil was very high ranging from 50-100:1, the new unconventional oil is much lower. I read that Tar Sands is around 5-6:1 and fracked oil is even less. I would think that is the real measure and not so much price. At what EROEI level do you think we will stop producing new wells? Will it have to hit 1:1?
Interesting that I was on the Oil Drum everyday for several years from 2006 -2010. About 2011 my interest faded because it everything flatlined.
"In the meantime, the situation has gotten quite dull. I compile graphs of oil production every month, and it's gotten somewhat akin to watching paint dry; every month, it's pretty much flat, and I tire of saying the same things over and over again."
Why we never do anything about issues like this, in a nutshell. If it starts to bore someone as engaged as you are, imagine the nanoseconds involved in losing the interest of the general public.
Newsflash: carbon economy will eventually end! The headline that could have been written in 1880 (and probably was, somewhere).
In the land of short attention spans, nothing ever gets done. Can't hold anyone's attention long enough. Long ago, I realized energy would be a stair step process. Crisis, bit of stabilization and another crisis as we move towards chaos. And that's for those of us with some economic security. For the average American, the crisis persists but they're way too busy making a living to chatter on about things.
Now we're in the stabilization (boredom) phase with millions left in the dust as they struggle ever harder to make it. Soon Bakken/Eagle Ford will peak and it's crisis again. Or in our war mongering society, we'll finally destabilize the Middle East. God knows we've worked hard enough at it.
Thanks Stuart, a balanced big-picture summary as always.
The one small disagreement I have is that things are boring at the moment. Although liquids are usually measured by volume, what really counts is the net energy which they yield to society. This is more nuanced and complicated than the original peak oil story based on conventional oil alone, but as such is rather more interesting.
The shallow upward gradient in C+C is entirely due to tar sands and tight oil, both marginal sources of supply at large environmental cost. Tar sands relies on cheap natural gas to be profitable. Tight oil is a classic bubble with misallocation of capital, woeful regulation and sharly diminishing returns. The situation with tight oil in particular seems to be quite dynamic, with significant yearly changes to flow rates, drilling and average returns.
An oft used metaphor is the cartoon coyote running off the edge of the cliff, legs pumping furiously. How long can the frantic motion delay the inevitable onset of gravity? We're seeing the dregs of liquid fuels being sucked out of the earth in a desperate attempt to keep our hydrocarbon addiction going. Each month sees a deterioration in EROI, so net energy is likely flat or at best rising very slowly.
Assuming 'peak oil' is defined as maximum rate of net energy flow, then I suspect we are not many years away. Tar sands can continue to expand slowly it seems, but tight oil will peak in volume terms this decade, and earlier in net energy terms.
I can understand that the original TOD cohort are feeling tired, after the peak oil debate has taken some unexpected twists and we're in an apparently stable phase. But dig down into the detail and IMO the key elements of peak oil are playing out in front of us, today, this year and for the next few years. In many ways it's a privilege to see and understand what's happening at such a critical inflexion point. In other ways is scary, because most of the world is still deep in denial and we'll have to adapt in uncomfortable ways once the net energy peak is passed (we ain't seen nothing yet).
All the main TOD contibutors should feel proud of providing such a valuable role in shaping awareness of peak oil and its likely remifications.
Well, thanks for watching that paint dry over the years, Stuart. ;) I've always preferred "counting beans" my self. Incidentally spare capacity spent most of the 90s at ca. 3.3 mb/d - sizable but not sky high by any means. Real prices hovered around $25/bbl. We had 3.6 mb/d in 2010 but a real price of $80/bbl. So much for that correlation!
Your work on subjects like the world's various vehicle fleets is what I've probably enjoyed the most, digging into the crux of this matter from all angles. An oil production peak, OK, will it matter? Mmmm, wonder what you'd find looking up "buggy whip" in the Google News Archives from a century ago...
Terrific analysis. And yes, the age of cheap light sweet crude is over.
But to understand what happens next, let's not forget all the remaining tar sands and all the peat bogs that can be converted to usable fuel.
Now that's a thought to focus the mind.
Our choices are 1) solar, wind and other forms of alternative energy 2) nuclear energy 3) A great deal more research into other possibilities.
Actually the first two choices also requires a great deal of research. And nuclear needs to rebuild its credibility, something proponents are curiously having trouble understanding.
My thanks also, Stuart, for watching the paint dry. On The Oil Drum, and here, you brought a great deal of clarity to a debate with more smoke and heat than light.
Your last point in this post is the big one for me: production peak or no, the OECD hit de facto peak oil in 2005.
On the North African-Middle Eastern turmoil:-
I remember that one of the blind spots of Oil Drum commenters was "above ground factors". Back in 2005-2008 Commenter after commenter would dismiss their importance, and largely meet agreement. Well, one can hardly do that now.
Leave aside the countries you mention above. If they had had better mineral ownership and exploitation laws for the last decade, Russia, Mexico, and Venezuela alone could probably be adding another 10 million barrels per day to global production.
And the list goes on. Nigeria. Argentina. Sudan and South Sudan. Angola. Colombia. Indonesia. India, even. All of them held back by their laws or absence of laws, corruption and weak government.
It's a good thing we don't need or want the oil, isn't it? :-)
Rather than a plateau at the end, I see a straight line from well into the zone you label "Seventies Oil Shocks" right up to the present. The slight bump at the beginning of the oughts makes it look a little like a sloped plateau.
There is definitely a discontinuity in the 70s, where the curve changes noticeably from, well, I guess you could fit a number of functions to it, but "concave up" says it, I guess. After that it's a pretty boring line.
Or is the smooth curve at the beginning a result of poorer data?
As I said over at TOD, I enjoyed your work a lot, Stuart. In the end I think our viewpoints were pretty closely aligned and that we moderates weren't too far off with our predictions.
Your blog will continue to be a regular stop for me. All the best.
A good summary as always Stuart - keep up the good work.
To my eye the slop from 2008 to 2012 is pretty close to the slop from 1987 to 2000. My model of the oil & gas industry through the last and this price shock that the price shock cause many investments to be made -building drilling rigs and equipment, Leasing land and signing exploration and development contracts, hiring and training people. As those investments happen people think of more innovative ways to find and produce oil. This sets the stage for many years of increasing production even in the face of a price fall.
Post a Comment